
Sugar and
Sugar Cane Pricing (JR142)
Introduction
Sugar is protected all around the world by high import duties
and export subsidies, Pakistan—have been keeping cane prices artificially high
in order to win farmers’ (Sugar mill owners) votes, leading to massive surges
in production.” Pakistan produces surplus sugar which is then exported, exports
require subsidies. The farmer does not get the benefit. Sugar cane is a water intensive
crop. We are therefore exporting scarce water. Sugarcane has replaced cotton
and this has necessitated import of cotton to make up the shortfall. This seems
to be a pricing regime set up to benefits the large industrial and political groups.
According to the SBP, the sugar cane output totaled 82.1m tonnes
in 2017-18 from $73.4m tonnes a year earlier an increase of 11.8 per cent. Just
how fast the sugar cane output has been growing can be gauged from the fact
that if we compare the 2017-18 output with 62.8m tonnes of 2014-15, we see
about 31pc growth in just three years.

International Sugar
prices
Sugar prices in the near past are presented as follows:
|
Sugar prices
|
||
|
Int
|
Pak
|
|
|
Price
|
Price
|
|
|
Year
|
$/lb
|
$/lb
|
|
2010
|
0.220
|
|
|
2011
|
0.270
|
|
|
2012
|
0.220
|
|
|
2014
|
0.1544
|
|
|
2015
|
0.1433
|
|
|
2016
|
0.1429
|
|
|
2017
|
0.158
|
0.143
|
|
2018
|
0.123
|
0.120
|
|
2019
|
0.127
|
|
|
Change %
|
-42.182
|
-22.221
|
Forecast
World sugar production is forecast to reach a record level of
187.6 million metric tons in the 2017-18 marketing year, according to the
United Nations’ Food and Agriculture Organization, or FAO. That would mark an
increase of just over 11% from the previous session.
“The substantial expected expansion in world sugar output means
that production is set to surpass utilization by as much as 17 million [metric
tons], the largest production surplus in history, leading to significant
accumulated inventories, in both importing and exporting countries,” the FAO
wrote in a biannual report published in July. Sugar cane production doesn’t
decline significantly as prices fall because the crop, which is classified as a
species of grass, can be cut back for five or six years in a row, meaning that
it is seldom dug up to plant another crop. Sugar is “protected all around the
world by high import duties and export subsidies.” The Indian government—and, to a lesser extent,
Pakistan—have been “keeping cane prices artificially high in order to win
farmers’ votes, leading to massive surges in production.” Against that
backdrop, uncertainty surrounds sugar demand.
Demand is “stationary” or even declining in the European Union,
the U.S. and Australia, says Shaw, as consumers opt for healthier alternatives. The U.S.
Department of Agriculture forecasts total domestic sugar use for the 2018-19
fiscal year at 11.33 million metric tons, little changed from the 11.27 million
expected for the current fiscal year. However, in the rest of the world, sugar
demand is “almost certainly still rising” due to population growth, if nothing
else, he says.
In China, sugar consumption for the 2018-19 marketing year is
forecast to stand unchanged at 15.7 million tons, with growth “limited by
increasing health concerns and competition from sugar and sweetener
replacements,” according to the FAO. Longer-term, sugar’s supply surplus will
eventually push prices so low that production takes a hit.
Sugar prices may see a rise to around 15 cents “sometime in
2020,” says Shaw, who estimates that the cost of production for efficient
producers such as Brazil and Thailand stands at roughly 12 cents to 14 cents a
pound, above the current price of 10 cents. “Prices will, of course, go up as
producers go bankrupt, but that is a very slow process,” he says.
Investors appear to be “dipping their toes in the water” given
inflows into sugar-based exchange-traded products, says Gilbertie, whose
company sponsors the Teucrium Sugar fund (ticker:
CANE), which offers unleveraged direct exposure to sugar. The inflows suggest
that investors are “taking a view that sugar prices could be at or near a
multiyear cyclical bottom,” he says. Meanwhile, sugar prices are likely to
decline even further. “I don’t see anything in the near term that suggests an
inevitable reversal of sugar’s drop,” says Kottle, adding that some analysts
expect to see eight cents a pound. That would be the lowest in roughly 14
years.

Pakistan Sugar Sector
Mushroom growth of sugar mills in the main cotton-growing areas of
Southern Punjab and Sindh has placed the cotton crop in direct competition with
sugar cane for area and resources,` says the State Bank of Pakistan (SBP) in
its first quarterly report of the current fiscal year. When a new sugar mill is
set up in an area, it incentivizes farmers to switch over from cotton or other
crops to sugar cane. New sugar mills began springing up and the government
started focusing more on the cultivation of sugar cane with 2008-09 At the end of 2007-08, there were 78
sugar mills, according to the Pakistan Sugar Mills Association (PSMA). The
number went up to 89 in 2017-

Sugarcane
Recoveries’
Periodic sugar recoveries of some sugar mills in the province
Punjab are 10.52 percent for JDW, RY Khan, 10.48 percent for Hamza,
Khanapur, 10.43 percent for Indus, Rajanpur, 9.95 percent for Noon, Bhalwal and
9.63 percent for Hussain, Jaranwala.
On the other hand, sugar recoveries of sugar mills located in
the Sindh are reported maximum (11.44 percent) in Mehran Sugar Mills Tando
Allahyar. Similarly, 10.85 percent in Faran, Hyderabad, 1075 percent in MPK,
Mirpur Khas, 10.71 percent in Shah Murad , Jhok sharif , 10.35 percent in Habib
Nawabshah, 9.95 percent in Al Noor, Mo rro
and 9.84 percent in Ansari, Matli during 2016-17.
The present average sugar recoveries of 9.5 percent can be
increased up to 11.5 percent by adopting improved agricultural practices. For this,
planting time, fertilizer-irrigation & harvest management, precautionary
measures in diseases along with insects and cane procurement strategies. No
doubt, cane variety is the single most dominant factor in improving sugar mills
recoveries. High sugar early maturing varieties have the potential of giving
11.5-12.5 percent recovery. A number of high sugarcane varieties have been
released by Sugarcane Research Institutes in Pakistan, during the past decades.
Impact of surplus sugar production
Our cotton production
routinely falls short of the needs of the textile industry. An unusual shortage
could hit the textile industry`s export performance and push up the total
import bill with increased imports of cotton. Imports of raw cotton increased
from 450,000 tonnes in 2012-13 to 610,000 tonnes in 2017-18 as local production
failed to meet the textile industry`s demand. In the outgoing fiscal year, the
cotton output totaled a little less than 12 million bales against the target of
14m bales. Imports of the commodity consumed $1 billion-plus Sugar exports
somewhat compensate the cost of cotton imports. In 2017-18, we earned half a
billion dollars through exports of sugar. That could not have been possible
without a surplus in sugar production, sugar millers argue. Cotton production
overtime is presented as follows:
|
Market Year
|
Production
|
Unit of Measure
|
Growth Rate
|
|
1960
|
1398
|
1000 480 lb. Bales
|
NA
|
|
1961
|
1505
|
1000 480 lb. Bales
|
7.65 %
|
|
1962
|
1690
|
1000 480 lb. Bales
|
12.29 %
|
|
1963
|
1940
|
1000 480 lb. Bales
|
14.79 %
|
|
1964
|
1747
|
1000 480 lb. Bales
|
-9.95 %
|
|
1965
|
1915
|
1000 480 lb. Bales
|
9.62 %
|
|
1966
|
2139
|
1000 480 lb. Bales
|
11.70 %
|
|
1967
|
2389
|
1000 480 lb. Bales
|
11.69 %
|
|
1968
|
2429
|
1000 480 lb. Bales
|
1.67 %
|
|
1969
|
2473
|
1000 480 lb. Bales
|
1.81 %
|
|
1970
|
2500
|
1000 480 lb. Bales
|
1.09 %
|
|
1971
|
3249
|
1000 480 lb. Bales
|
29.96 %
|
|
1972
|
3100
|
1000 480 lb. Bales
|
-4.59 %
|
|
1973
|
2909
|
1000 480 lb. Bales
|
-6.16 %
|
|
1974
|
2802
|
1000 480 lb. Bales
|
-3.68 %
|
|
1975
|
2269
|
1000 480 lb. Bales
|
-19.02 %
|
|
1976
|
1921
|
1000 480 lb. Bales
|
-15.34 %
|
|
1977
|
2539
|
1000 480 lb. Bales
|
32.17 %
|
|
1978
|
2132
|
1000 480 lb. Bales
|
-16.03 %
|
|
1979
|
3417
|
1000 480 lb. Bales
|
60.27 %
|
|
1980
|
3280
|
1000 480 lb. Bales
|
-4.01 %
|
|
1981
|
3434
|
1000 480 lb. Bales
|
4.70 %
|
|
1982
|
3782
|
1000 480 lb. Bales
|
10.13 %
|
|
1983
|
2271
|
1000 480 lb. Bales
|
-39.95 %
|
|
1984
|
4630
|
1000 480 lb. Bales
|
103.87 %
|
|
1985
|
5587
|
1000 480 lb. Bales
|
20.67 %
|
|
1986
|
6062
|
1000 480 lb. Bales
|
8.50 %
|
|
1987
|
6744
|
1000 480 lb. Bales
|
11.25 %
|
|
1988
|
6551
|
1000 480 lb. Bales
|
-2.86 %
|
|
1989
|
6687
|
1000 480 lb. Bales
|
2.08 %
|
|
1990
|
7522
|
1000 480 lb. Bales
|
12.49 %
|
|
1991
|
10000
|
1000 480 lb. Bales
|
32.94 %
|
|
1992
|
7073
|
1000 480 lb. Bales
|
-29.27 %
|
|
1993
|
6282
|
1000 480 lb. Bales
|
-11.18 %
|
|
1994
|
6250
|
1000 480 lb. Bales
|
-0.51 %
|
|
1995
|
8272
|
1000 480 lb. Bales
|
32.35 %
|
|
1996
|
7319
|
1000 480 lb. Bales
|
-11.52 %
|
|
1997
|
7175
|
1000 480 lb. Bales
|
-1.97 %
|
|
1998
|
6863
|
1000 480 lb. Bales
|
-4.35 %
|
|
1999
|
8776
|
1000 480 lb. Bales
|
27.87 %
|
|
2000
|
8379
|
1000 480 lb. Bales
|
-4.52 %
|
|
2001
|
8286
|
1000 480 lb. Bales
|
-1.11 %
|
|
2002
|
7972
|
1000 480 lb. Bales
|
-3.79 %
|
|
2003
|
7845
|
1000 480 lb. Bales
|
-1.59 %
|
|
2004
|
11138
|
1000 480 lb. Bales
|
41.98 %
|
|
2005
|
9850
|
1000 480 lb. Bales
|
-11.56 %
|
|
2006
|
9580
|
1000 480 lb. Bales
|
-2.74 %
|
|
2007
|
8550
|
1000 480 lb. Bales
|
-10.75 %
|
|
2008
|
8540
|
1000 480 lb. Bales
|
-0.12 %
|
|
2009
|
9240
|
1000 480 lb. Bales
|
8.20 %
|
|
2010
|
8640
|
1000 480 lb. Bales
|
-6.49 %
|
|
2011
|
10600
|
1000 480 lb. Bales
|
22.69 %
|
|
2012
|
9300
|
1000 480 lb. Bales
|
-12.26 %
|
|
2013
|
9500
|
1000 480 lb. Bales
|
2.15 %
|
|
2014
|
10600
|
1000 480 lb. Bales
|
11.58 %
|
|
2015
|
7000
|
1000 480 lb. Bales
|
-33.96 %
|
|
2016
|
7700
|
1000 480 lb. Bales
|
10.00 %
|
|
2017
|
8200
|
1000 480 lb. Bales
|
6.49 %
|
|
2018
|
7500
|
1000 480 lb. Bales
|
-8.54 %
|
Cotton production since 2004 has decreased by about 30%. Decrease
in cotton production has necessitated import of cotton, cotton imports s is
presented as follows:
|
Market Year
|
Imports
|
Unit of Measure
|
Growth Rate
|
|
1960
|
4
|
1000 480 lb. Bales
|
NA
|
|
1961
|
42
|
1000 480 lb. Bales
|
950.00 %
|
|
1962
|
9
|
1000 480 lb. Bales
|
-78.57 %
|
|
1963
|
4
|
1000 480 lb. Bales
|
-55.56 %
|
|
1964
|
9
|
1000 480 lb. Bales
|
125.00 %
|
|
1965
|
7
|
1000 480 lb. Bales
|
-22.22 %
|
|
1966
|
10
|
1000 480 lb. Bales
|
42.86 %
|
|
1967
|
4
|
1000 480 lb. Bales
|
-60.00 %
|
|
1968
|
4
|
1000 480 lb. Bales
|
0.00 %
|
|
1969
|
0
|
1000 480 lb. Bales
|
-100.00 %
|
|
1970
|
6
|
1000 480 lb. Bales
|
NA
|
|
1971
|
7
|
1000 480 lb. Bales
|
16.67 %
|
|
1972
|
4
|
1000 480 lb. Bales
|
-42.86 %
|
|
1973
|
2
|
1000 480 lb. Bales
|
-50.00 %
|
|
1974
|
1
|
1000 480 lb. Bales
|
-50.00 %
|
|
1975
|
0
|
1000 480 lb. Bales
|
-100.00 %
|
|
1976
|
2
|
1000 480 lb. Bales
|
NA
|
|
1977
|
1
|
1000 480 lb. Bales
|
-50.00 %
|
|
1978
|
4
|
1000 480 lb. Bales
|
300.00 %
|
|
1979
|
4
|
1000 480 lb. Bales
|
0.00 %
|
|
1980
|
5
|
1000 480 lb. Bales
|
25.00 %
|
|
1981
|
5
|
1000 480 lb. Bales
|
0.00 %
|
|
1982
|
4
|
1000 480 lb. Bales
|
-20.00 %
|
|
1983
|
240
|
1000 480 lb. Bales
|
5,900.00 %
|
|
1984
|
9
|
1000 480 lb. Bales
|
-96.25 %
|
|
1985
|
6
|
1000 480 lb. Bales
|
-33.33 %
|
|
1986
|
3
|
1000 480 lb. Bales
|
-50.00 %
|
|
1987
|
4
|
1000 480 lb. Bales
|
33.33 %
|
|
1988
|
5
|
1000 480 lb. Bales
|
25.00 %
|
|
1989
|
17
|
1000 480 lb. Bales
|
240.00 %
|
|
1990
|
2
|
1000 480 lb. Bales
|
-88.24 %
|
|
1991
|
20
|
1000 480 lb. Bales
|
900.00 %
|
|
1992
|
24
|
1000 480 lb. Bales
|
20.00 %
|
|
1993
|
350
|
1000 480 lb. Bales
|
1,358.33 %
|
|
1994
|
696
|
1000 480 lb. Bales
|
98.86 %
|
|
1995
|
122
|
1000 480 lb. Bales
|
-82.47 %
|
|
1996
|
279
|
1000 480 lb. Bales
|
128.69 %
|
|
1997
|
120
|
1000 480 lb. Bales
|
-56.99 %
|
|
1998
|
925
|
1000 480 lb. Bales
|
670.83 %
|
|
1999
|
475
|
1000 480 lb. Bales
|
-48.65 %
|
|
2000
|
470
|
1000 480 lb. Bales
|
-1.05 %
|
|
2001
|
865
|
1000 480 lb. Bales
|
84.04 %
|
|
2002
|
872
|
1000 480 lb. Bales
|
0.81 %
|
|
2003
|
1805
|
1000 480 lb. Bales
|
107.00 %
|
|
2004
|
1756
|
1000 480 lb. Bales
|
-2.71 %
|
|
2005
|
1615
|
1000 480 lb. Bales
|
-8.03 %
|
|
2006
|
2305
|
1000 480 lb. Bales
|
42.72 %
|
|
2007
|
3907
|
1000 480 lb. Bales
|
69.50 %
|
|
2008
|
1917
|
1000 480 lb. Bales
|
-50.93 %
|
|
2009
|
1574
|
1000 480 lb. Bales
|
-17.89 %
|
|
2010
|
1443
|
1000 480 lb. Bales
|
-8.32 %
|
|
2011
|
900
|
1000 480 lb. Bales
|
-37.63 %
|
|
2012
|
1800
|
1000 480 lb. Bales
|
100.00 %
|
|
2013
|
1200
|
1000 480 lb. Bales
|
-33.33 %
|
|
2014
|
950
|
1000 480 lb. Bales
|
-20.83 %
|
|
2015
|
3300
|
1000 480 lb. Bales
|
247.37 %
|
|
2016
|
2450
|
1000 480 lb. Bales
|
-25.76 %
|
|
2017
|
3300
|
1000 480 lb. Bales
|
34.69 %
|
|
2018
|
3000
|
1000 480 lb. Bales
|
-9.09 %
|
Pakistan had to import over 4 million cotton bales that cost around $1.5 billion, owing to declining production
of cotton this season imports of such a
large quantity would not only increased the country's import bill, but also the
cost of production. Currently customs duty, additional custom duty and sales
tax have been imposed @ 3 percent, 1 percent and 5 percent respectively on the
import of cotton.
Pakistan has produced around 10 million bales of
cotton on average for the last several years against consumption of over 14
million bales. Additionally, 1 to 1.5 million bales of Extra Long Staple (ELS)
cotton per annum is also imported, as this quality is not produced in the
country.

Yields and
Pricing of Sugarcane
Estimated yield of sugarcane in Pakistan is much lower as
compared to other countries and sugarcane production showed a declining trend
in 2018-19 despite increase in cultivation area, sugarcane cultivation area has
been increased in the last 7 years by 9 percent on an average, whereas the
production has increased by 22 percent. However, estimated sugarcane production
showed a declining trend in 2018-19 due to multiple factors. Sugarcane
production accounted for 3.6 percent in agriculture's value addition and 0.7
percent in overall GDP and is mainly cultivated for sugar and sugar-related
products like alcohol, molasses, and press-mud with an input for paper and
board industry. Additionally, ethanol and
electricity are also being produced by some sugar mills. It provides raw
material for industry which is the country's second largest agro-industry
sector after textiles. Pakistan ranks 5th in respect of acreage and production,
however, its level of yield is ranked 53rd in the world. Average yield of sugarcane in Pakistan is 620-700
maunds per acre, which is much lower as compared to other cane producing
countries. Presently, 82 sugar mills of the country are engaged to produce
sugar with the production capacity of 6.8 million tons of sugar per annum as
compared to national consumption of 5.3 million tons per annum.
Ministry of National Food Security & Research has regularly worked out the cost of production of sugarcane crop. In order to determine an appropriate indicative price for the next crop, all determinant factors are considered, like area and production, world outlook, cost of production, export and import parity prices, local and international prices and domestic requirement. Ministry of National Food Security & Research before the start of each sugar crushing season shares this working on the cost of production to the provincial governments. Sugar Factories Control Act, 1950 authorizes the provincial governments to fix the indicative price of sugarcane.
Cost of production of sugarcane crop 2018-19 had been worked out at the level of Rs 179/40 kg in Punjab as compared to Rs 169.22/40 kg in the last year and Rs 178.08/40 kg for Sindh as compared to Rs 171.96/40 kg of the corresponding period of last year. Khyber Pakhtunkhwa uses the indicative price of sugarcane fixed by Punjab.
Ministry of Industries and Production for the crushing season 2017-18 has estimated ex-mill price/manufacturing cost of sugar at the level of Rs 45.86/kg. It is estimated that at sugar recovery level of 9.96 percent, additional molasses with 4.4 percent is also produced which yields an additional profit of Rs 21.12/40kg.
Some sugar mills have installed extra plants for manufacturing of alcohol and electricity, which yield extra profit margin for sugar mill owners. The Ministry of Industries and Production has reported the sugar stock position for the crushing season 2017-18 (October-September) at the tune of 7.158 million tons.The quantity includes 3.856 million tons with Punjab, 2.281 million tons with Sindh, 0.470 million tons with Khyber Pakhtunkhwa and leftover stock of 0.541 million tons. Pakistan Bureau of Statistics on 15-11-2018 reported the wholesale local price of refined sugar at the level of Rs 54.88/kg. International Sugar Organisation has quoted the sugar prices, which fluctuates between US $ 335- 353/tons during the month of November 2018 (November 1-15 2018).
Surplus
An intriguing aspect of the excessive cultivation of sugar cane is that often the surplus cannot be exported without offering the millers some sort of subsidy. This happens due to delays in finalising sugar export plans, high cost of domestic production and international market conditions. The SBP quarterly report points out that in the last fiscal year, the monthly average price of local sugar stood at $448 per tonne compared to the global average of about $330.The government had to give a subsidy ofRs14bn on sugar exports. What is more intriguing is the fact that larger sugar cane outputs year after year are not even helping farmers.
Millers pay them less than the indicative or support price of the commodity. Particularly, small growers suffer due to this anomaly. Yet the government continues to spend billions of rupees under commodity pricing subsidies. So technically, sugar exports are costing more to the government than the accrued benefits as a significant expenditure is incurred on facilitating these exports, according to the SBP`s quarterly report.

Water requirements
According to a WWF Pakistan chapter report of 2012, growing sugar cane also consumes more water: 0.05m cubic meters per hectare against cotton (0.02mcm per hectare) and even rice (0.03mcm per hectare).For several years, Pakistan`s water woes have been growing. The scarcity of water continues to ruin the prospects of crop outputs in large parts of Sindh, Balochistan and some areas of Punjab. `But if we don`t limit sugar cane cultivation, the economy might continue to suffer due to the erratic output of cotton and rice. That, in turn, might keep net textile exports low and affect growth of rice exports. Perhaps it`s time to initiate a major crop rationalisation plan with the consent of the provinces focusing on ensuring food adequacy, effective use of water, higher per-hectare yields and highest export value of the surplus output. But encouraging farmers to switch over from sugar cane to cotton, rice or any other crop will also require the introduction of solid provincial work plans with feedback from farmers` lobbies and local and international experts on agriculture.
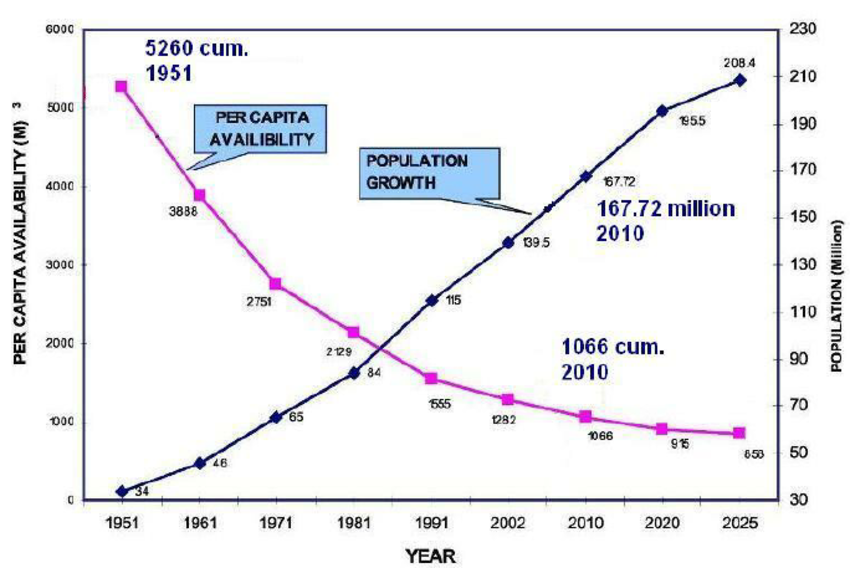
Water availability per capita in Pakistan has depleted to a
level of 1017 cubic meter tons in Pakistan – very close to 1000 cubic meters,
which is considered as an alarming situation and is called scarcity threshold.
Using data from the Pakistani federal government's Planning and Development
Division, the overall water availability has decreased from 1,299 m³ per capita
in 1996-97 to 1,101 m³ per capita in 2004-05.In view of growing population, urbanization
and increased industrialization,
the situation is likely to get worse increasing pollution and saltwater intrusion threaten the country's
water resources. About 36% of the groundwater
is classified as highly saline.
Water requirements for some crops are presented as follows:
|
Crop
|
Crop water need
(mm/total growing period) |
|
Banana
|
1200-2200
|
|
Barley/Oats/Wheat
|
450-650
|
|
Bean
|
300-500
|
|
Cabbage
|
350-500
|
|
Citrus
|
900-1200
|
|
Cotton
|
700-1300
|
|
Maize
|
500-800
|
|
Melon
|
400-600
|
|
Onion
|
350-550
|
|
Peanut
|
500-700
|
|
Pea
|
350-500
|
|
Pepper
|
600-900
|
|
Potato
|
500-700
|
|
Rice (paddy)
|
450-700
|
|
Sorghum/Millet
|
450-650
|
|
Soybean
|
450-700
|
|
Sugar beet
|
550-750
|
|
Sugarcane
|
1500-2500
|
|
Sunflower
|
600-1000
|
|
Tomato
|
400-800
|
Sugar
cane is a water intensive crop; it has the highest water requirement amongst
the crops, listed above.
|
Present
sugar cane situation
Pakistan's sugarcane yield averages about 46 tonnes per hectare,
well below the world average of above 60 tonnes, and below neighboring
India's yield of 65 to 70 tonnes. However, yields are increasing over time,
at a rate of between 0.5 and 1.0 tonne per hectare annually. Yields in the
Punjab, were relatively constant at 37 tonnes per hectare for about 10 years
and only recently started rising to over 45 tonnes per hectare. However,
individual farmers have obtained yields of 120 tonnes per ha. Precipitation
averages only 335 ml a year in the Punjab, so irrigation is crucial, but the
total supply of water is limited. Yields in the Sind Province are above 50
tonnes per hectare, significantly higher than in Punjab. The growth rate in
sugarcane production in Sind has exceeded Punjab in recent years. However,
because of its larger area under sugarcane, the Punjab produces the major
share of the national output, and for 1997/98 output in this province is
forecast to increase by 10 percent to 29 million tonnes, while Sind is
expected to produce 13 million tonnes, unchanged from 1996/97
Small farmers often are not selling sugarcane crop to the sugar factory, for it was of fetching an inadequate price of Rs120/40kg against the notified price of Rs182/40kg for the 2018-19 season. Small framers he preferred jaggery manufacturing, some larger framers sell their crop to cattle traders as fodder as they find this option somewhat more profitable than selling their produce to sugar factory owners. The growers are not only getting payment in cash but also saving on other expenditures, ranging from the cost of harvesting/cleansing grass attached with sugarcane, to transportation a and off loading at the factory`s gate. Selling crop for livestock and cattle is not at all a bad bargain under the existing conditions this year, when factories are unwilling to pay the due price,` Of the country`s 80-plus sugar factories, 38 are located in Sindh and close to 50 in Punjab. Wealthy mill owners are once again denying farmers the notified price and seeking judicial intervention though there may be little chance of getting a favorable order Farmers will want to free up land for other crops. As sugarcane crushing draws closer millers will start paying more than the notified price. But by this time growers have already sold their major chunk of crop at a low rate to middlemen who act as millers` agents. `Fodder`s price remains high this year and it enables us to sell our produce,` Those rearing animals and livestock herds are paying Rs140/40kg for sugarcane and it is a price millers deny. Fodder traders are bringing their laborers to harvest crop and are transporting it from fields to their workplace for onward sale. Sugarcane producers get payment on the basis of the weight of the crop that is supplied after grass has been cleaned from each stick of sugarcane. This reduces the weight. Millers then make deductions, on flimsy grounds. In Sindh, sugarcane cultivation has become a tricky job. The sugar industry has seen unnatural growth in Sindh over last few years, even though water shortages had serious implications of this water-intense crop. .Sugarcane is almost a year-long crop, needing plenty of water flows till it matures. In the last kharif 2018 season, Sindh faced an overall 18pc water shortage. Reduced irrigation water flows are a regular phenomenon, especially in the command areas of the Sukkur and Kotri barrages, making sugarcane cultivation increasingly unviable. Pakistan`s sugar millers are mostly influential politicians. With their connections, they call the shots, while farmers end up hard done by. Despite billions of rupees worth of subsidies from the public exchequer to millers, the federal and provincial governments fail to get the price notification implemented. `Pakistan is producing more sugar than its consumption needs, which is around 5.2m tonnes to 5.5m tonnes, necessitating the export of surplus sweetener for which millers pressurise the government to provide subsidies,` In the 2017-18 season the Sindh government paid a provincial subsidy of Rs3.25bn (Rs9.30/1kg) to sugar mills located in Sindh as export rebate; of 1.7m tonnes of Pakistani sugar`s export, 0.9m tonnes were exported from Sindh. The State Bank of Pakistan is said to have asked the Sindh government to pay its remaining share out of the federal subsidy., the real issue is that farmers don`t get adequate price. |
·
Weighing
woes India
·
On
the one hand, a large section of sugarcane cultivators perceive that cane
supplied by them to mills is weighed less than actual by about 10 to 20
percent, whereas on the other, millers maintain that they weigh it accurately.
To improve trust and harmony between the two stakeholders, the Commission
recommends that Government of India should persuade the State Governments/Cane
Commissioners to make adequate arrangements for electronic balances which
measure and display the actual weights. These balances should be open to
scrutiny for its accuracy by concerned stakeholders.

Sugar cane
and sugar pricing examples
To help
ensure fair and equitable relationships between growers and millers, these
groups established an innovative sugarcane payment system in 1999. The Consecana payment system
is based on two fundamental principles:
1.
The
price paid to cane producers is proportional to their share of industrial
revenue. On average, sugarcane production accounts for 60 percent of total
sugar and ethanol production costs. Therefore, sugarcane growers receive around
60 percent of the agro-industrial revenue.
2.
The
industry pays more for sugarcane with higher sucrose content. The value of
sugarcane is based on the so-called Total Recoverable Sugar (or ATR in
Portuguese). ATR corresponds to the amount of sugar available in the raw
material minus the losses in the manufacturing process.
The money sugarcane growers collect depends
on the prices for sugar and ethanol sold by processors in domestic and foreign
markets. So transparency is crucial to the Consecana model. Price surveys of
Brazilian and international markets are conducted by a neutral body – the Center for Advanced Studies in
Applied Economics (Cepea), a research center within the University of São Paulo.
In addition, cane growers have the right to monitor mill laboratories 24 hours
per day.
Consecana is a dynamic system, and the
group reevaluates its rules every five years to adapt to new market
developments. Other sugarcane producing states consider this fair-pricing
program a success, and many have either adopted a similar system or to rely on
information from Consecana
Sugar
Pricing India
Around 5 crore Indian farmers and their
family members grow sugarcane for 12-18 months on around 50 lakh hectares of
land. A ratoon of 1-2 years, when farmers don’t have to put fresh seed, means
once the farmers plant sugarcane, they are committed to grow sugarcane for 2-3
years. It also means that when the farmers commit themselves to sugarcane, they
don’t know what the sugar price would be after a year or more. The government
does well to protect farmers by deciding the price of sugarcane, called the
fair and remunerative price (FRP). But on the other hand, sugar prices are
determined by market sentiments and market forces, and the government can’t
have much direct control over it. Everything remains good until the high FRP of
sugarcane results in over-production of cane and sugar. If that in turn causes
sugar prices to fall below cost levels, the mills incur losses, leading to
delays/defaults in payments of farmers. Sugarcane
contributes for 70-75% of the cost of producing sugar. Therefore, if cane-price
is high and sugar prices low, sugar production becomes unviable, resulting in
unpaid cane-price for farmers. Cane-price arrears of farmers had unfortunately
crossed Rs 18,000-20,000 crore continuously for a few years some time back. It
meant that either every third farmer did not get his payment on time or a
farmer got only of two-thirds of the amount due to him. Both situations are
surely alarming and chaotic. The solution
already suggested by the Commission for Agricultural Costs and Prices
(CACP)—continuously for the last four years— is as follows:
a) Farmers should be guaranteed a
minimum cane price at the level of FRP,
b) Liability of sugar mills will be
restricted as per a revenue sharing formula (RSF), such that 75% of revenue
realized from sugar (including weight age of 5% for other primary by-products)
will be the cane price payable by mills.
c) If the cane-price, as per RSF, is
more than FRP, the farmers get a second installment over and above the FRP.
d) If the price as per RSF works out to
below FRP (which will happen when sugar prices are depressed), the gap would be
paid from a fund created by the government, directly to the farmers.
It means
that sugar mills will pay as per their revenue realization, i.e., as per their
paying capacity. Therefore, farmers will get paid on time. It will also keep
cost of production reasonable, ensuring Indian sugar is competitive globally to
allow exporting the surplus. On the other hand, farmers get cane price at least
at the level of FRP, or more when sugar prices are better, an improvement over
the current system of giving farmers only FRP. Such a linkage formula between
cane-price and revenue realisation from sugar is universal, given it is
followed in almost all sugar-producing countries, and will put Indian industry
on a par with other global players. The CACP’s suggestion of a fund is in fact
an improvement, particularly for the Indian farmers, where they are guaranteed
a minimum FRP, even when sugar prices are down, and would get more if sugar
prices are good.
. A
combination of Revenue Sharing Formula (RSF) and Fair (India) and
Remunerative Price FRP while fixing price of sugarcane. Under this approach
farmers’ realization from the cane would be higher when sugar prices are on
upswing. However, farmers may end up getting lower prices than the FRP during
the period of downward cycle of sugar prices. In such a situation, the farmers should
be paid FRP up front and the difference between FRP and prices determined by
RSF should be met by Sugar Stabilization Fund (SSF). This recommendation
essentially has three components namely (i) FRP, (ii) RSF and (iii) SSF and all
these were to be implemented as an ‘atomic whole’ for the viability of the
sugar industry. The Commission recommends that all the three components of
hybrid pricing approach should be implemented simultaneously. Such a rational
approach for sugarcane pricing would provide a logical solution to the travails
of both the cane farmers and the sugar industry.